The Overall Question Metrics provides comprehensive quality and performance analytics for assessment questions over a specified academic period. This system excludes combined assessments to focus on individual question-level analysis.
Core Metrics Breakdown
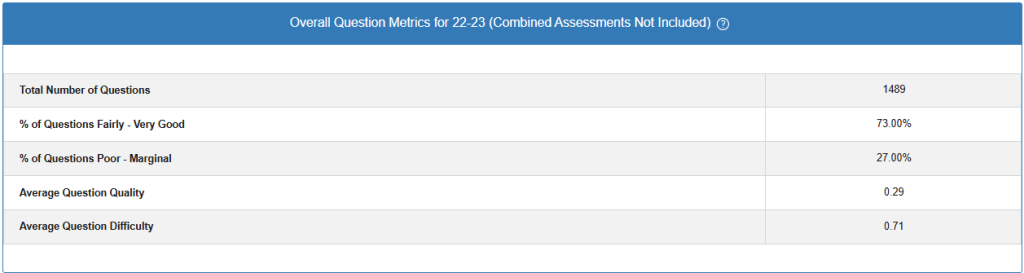
Total Number of Questions
Value: 1,489
Description: The complete count of individual assessment questions analyzed during the reporting period. This represents the sample size for all subsequent quality calculations.
Question Quality Distribution
% of Questions Fairly – Very Good: 73.00%
Calculation:
(Number of questions rated Fairly-Very Good / Total Questions) × 100
= (1,087 / 1,489) × 100 = 73.00%
% of Questions Poor – Marginal: 27.00%
Calculation:
(Number of questions rated Poor-Marginal / Total Questions) × 100
= (402 / 1,489) × 100 = 27.00%
Validation Check: 73.00% + 27.00% = 100% ✓
Average Question Quality: 0.29
This metric uses a normalized quality scale where:
- Scale Range: Typically 0.0 (lowest quality) to 1.0 (highest quality)
- Current Value: 0.29 indicates below-average question quality
- Calculation Method: Likely uses weighted scoring based on psychometric properties such as:
- Discrimination index
- Point-biserial correlation
- Distractor effectiveness
- Content validity ratings
Average Question Difficulty: 0.71
This represents the mean difficulty coefficient across all questions:
- Scale Range: 0.0 (very easy – 100% correct) to 1.0 (very difficult – 0% correct)
- Current Value: 0.71 indicates moderately difficult questions
- Formula:
Difficulty = 1 - (Number of correct responses / Total responses)- Interpretation: Questions are answered correctly by approximately 29% of test-takers on average
Technical Implementation Notes
Data Aggregation
- Time Period: Academic year 22-23
- Scope: Individual assessments only (combined assessments filtered out)
- Processing: Real-time aggregation with periodic batch updates
Quality Assessment Algorithm
The system employs a multi-factor quality scoring algorithm:
Quality Score = w₁(Discrimination) + w₂(Reliability) + w₃(Content_Validity) + w₄(Distractor_Analysis)Where w₁, w₂, w₃, w₄ are predetermined weights totaling 1.0.
Performance Benchmarks
- Target Quality Range: 0.4-0.8 (recommended for most assessment contexts)
- Target Difficulty Range: 0.3-0.7 (optimal discrimination potential)
- Quality Distribution Goal: >80% questions in Fairly-Very Good category
Actionable Insights
Based on these metrics:
- Quality Improvement Needed: 27% of questions require revision or replacement
- Difficulty Optimization: Current difficulty level may be too high for optimal discrimination
- Content Review Priority: Focus on the 402 poor-marginal questions for immediate attention
This data supports evidence-based decisions for assessment improvement and quality assurance processes within the OnTarget platform.