- Associated Instructional Materials:
Point Biserial Correlation (rpb) measures the relationship between a dichotomous variable (correct/incorrect response to a specific item) and a continuous variable (total test score). It quantifies how well an individual test item discriminates between high-performing and low-performing examinees.
What the Chart Shows You
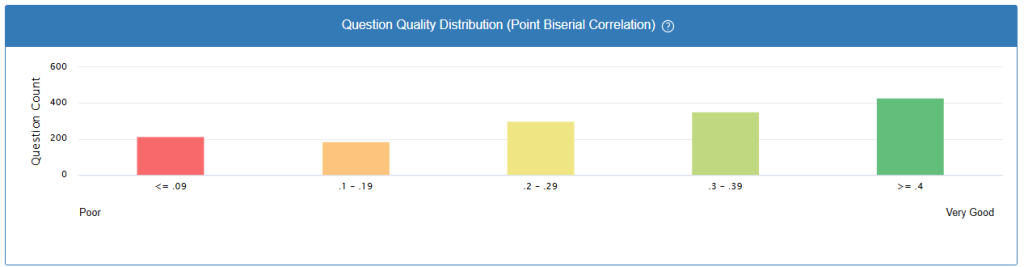
The Point Biserial Correlation chart displays the distribution of test items across different correlation coefficient ranges, providing a comprehensive view of overall test quality and item discrimination effectiveness. This visualization is essential for psychometric analysis and test validation in educational assessment platforms.
Formula and Calculation
The point biserial correlation coefficient is calculated using:
rpb = (M₁ – M₀) × √(p × q) / SD
Where:
- M₁ = Mean total score of examinees who answered the item correctly
- M₀ = Mean total score of examinees who answered the item incorrectly
- p = Proportion of examinees who answered correctly
- q = Proportion of examinees who answered incorrectly (1 – p)
- SD = Standard deviation of all total test scores
Alternative computational formula: rpb = (M₁ – M_total) × √(p/q) / SD_total
Correlation Range Interpretations
≤ 0.09 (Poor – Red)
- Quality Level: Unacceptable
- Interpretation: Items show virtually no discrimination between high and low performers
- Action Required: Remove or extensively revise these items
- Possible Issues: Ambiguous wording, multiple correct answers, or content misalignment
0.1 – 0.19 (Below Average – Orange)
- Quality Level: Marginal
- Interpretation: Weak discrimination capability
- Action Required: Review and consider revision
- Potential Problems: Unclear instructions, minor content issues, or difficulty level misalignment
0.2 – 0.29 (Acceptable – Yellow)
- Quality Level: Minimally acceptable
- Interpretation: Adequate discrimination for most purposes
- Action Required: Monitor performance, minor revisions may improve effectiveness
- Status: Acceptable for low-stakes assessments
0.3 – 0.39 (Good – Light Green)
- Quality Level: Good discrimination
- Interpretation: Items effectively differentiate between ability levels
- Action Required: Maintain current form, minor optimization possible
- Performance: Suitable for most assessment contexts
≥ 0.4 (Very Good – Dark Green)
- Quality Level: Excellent discrimination
- Interpretation: Superior items that strongly correlate with overall performance
- Action Required: Retain as anchor items for test security
- Performance: Ideal for high-stakes assessments
Chart Analysis Framework
Distribution Pattern Assessment
- Optimal Distribution: Higher concentrations in 0.3+ ranges
- Warning Signs: Heavy concentration in ≤0.19 ranges
- Quality Indicators: Balanced distribution across acceptable ranges (0.2+)
Statistical Thresholds
- Minimum Acceptable: rpb ≥ 0.20 for operational use
- Preferred Range: rpb ≥ 0.30 for high-stakes testing
- Excellence Benchmark: rpb ≥ 0.40 for discriminating items
Psychometric Implications
Test Reliability Impact
Items with higher point biserial correlations contribute more to overall test reliability. The relationship follows: Reliability ∝ Σ(rpb²)
Validity Considerations
Strong point biserial correlations suggest:
- Content alignment with learning objectives
- Appropriate cognitive demand levels
- Clear, unambiguous item construction
- Effective distractor quality (for multiple-choice items)
Item Response Theory Connection
Point biserial correlation relates to IRT discrimination parameters:
- Higher rpb values typically correspond to higher discrimination (a-parameters)
- Facilitates transition to more sophisticated IRT analyses
Quality Assurance Metrics
Acceptable Test Standards
- Minimum: 80% of items with rpb ≥ 0.20
- Good: 60% of items with rpb ≥ 0.30
- Excellent: 40% of items with rpb ≥ 0.40
Flagging Criteria
- Items with rpb ≤ 0.10 require immediate review
- Items with rpb ≤ 0.19 need revision consideration
- Negative correlations indicate serious item flaws
This distribution analysis provides essential feedback for test development, item bank management, and ongoing quality assurance in educational assessment systems.