This visualization represents a Difficulty Estimate using Rasch Method showing the calibrated difficulty parameters for 20 assessment items. Here are the key technical components:
Core Rasch Model Elements
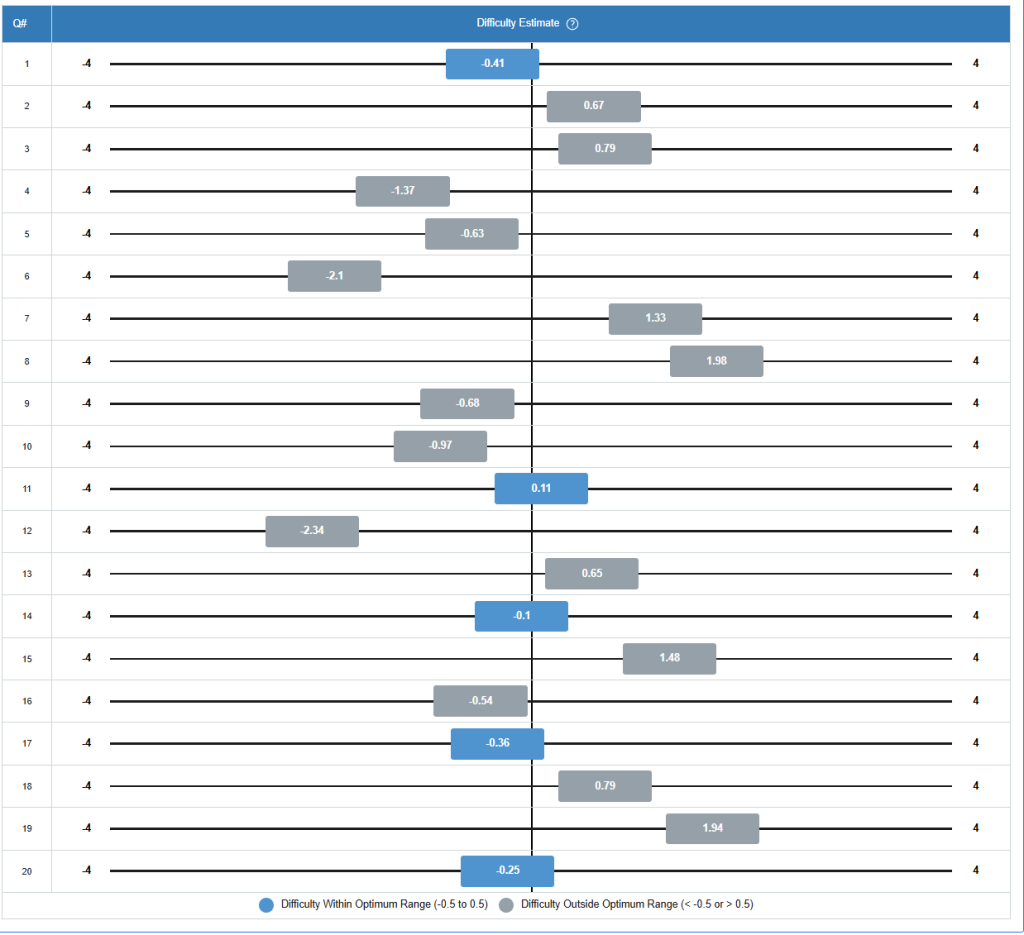
Question Difficulty Parameters (θ): Each numbered item (1-20) displays its calibrated difficulty estimate on the logit scale, ranging from -2.34 (easiest item #12) to +1.98 (most difficult item #8). These estimates represent the point on the ability continuum where a person has a 50% probability of responding correctly.
Logit Scale: The horizontal axis uses the logit metric, with 0.0 representing the mean difficulty. Negative values indicate easier items, while positive values indicate more difficult items.
Optimal Difficulty Range Analysis
The visualization employs a color-coded classification system:
- Blue questions (Questions 1, 11, 14, 17, 20): Fall within the “optimum range” of -0.5 to +0.5 logits, indicating well-targeted items for the assessed population
- Gray questions: Exceed the optimal range (either < -0.5 or > +0.5), suggesting potential targeting issues
Technical Specifications
Cut Score Column: All questions show a value of “4,” likely representing a polytomous rating scale cutpoint or threshold parameter in the Rasch partial credit model.
Measurement Precision: The difficulty estimates appear calibrated to two decimal places, indicating high-precision item parameter estimation.
Psychometric Implications
This analysis enables questions targeting evaluation – questions within the blue range are optimally positioned for reliable measurement of the target population’s ability level. Questions outside this range may require review for potential revision, elimination, or redeployment to different ability groups.
The vertical reference line at 0.0 represents the baseline difficulty level, facilitating quick visual assessment of question distribution around the population mean.