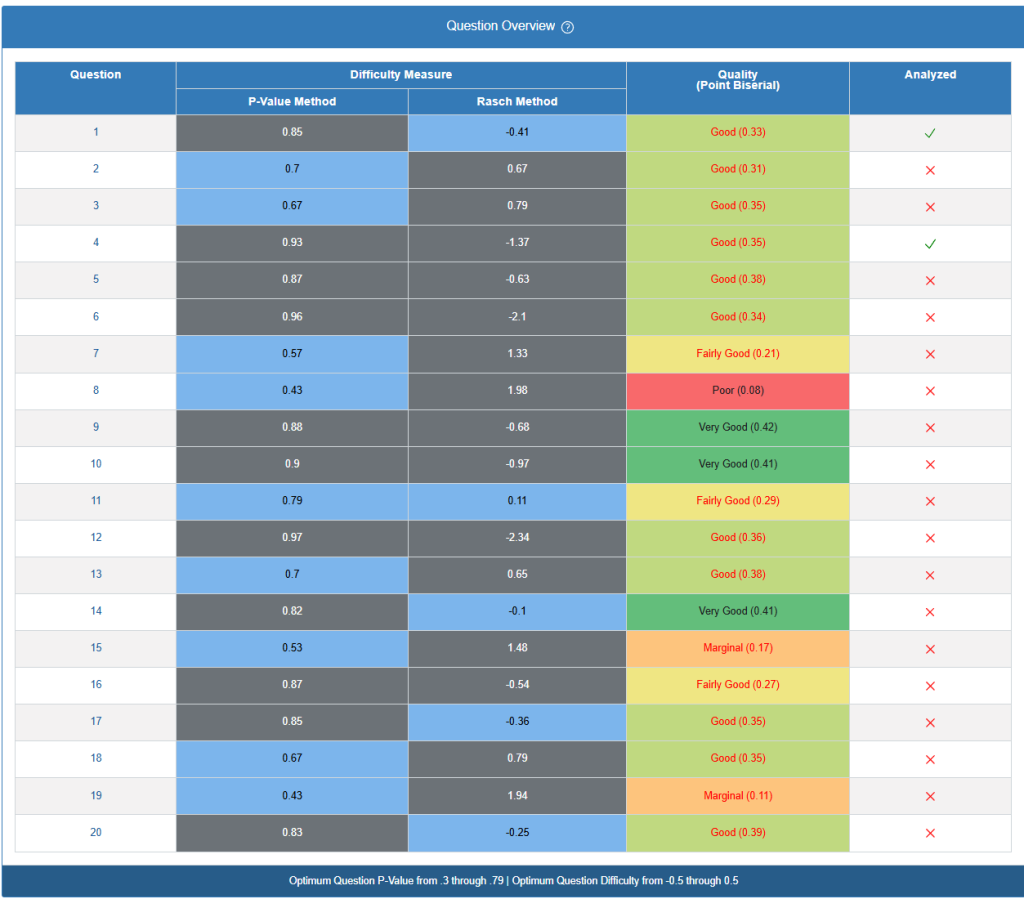
The Question Overview provides a comprehensive psychometric analysis of test items, displaying key statistical measures used to evaluate question quality and difficulty across multiple methodologies.
Column Structure
Question Column: Sequential numbering (1-20) identifying each test item in the assessment.
Difficulty Measure: Dual-method approach for measuring item difficulty:
P-Value Method: Classical Test Theory approach calculating the proportion of examinees who answered correctly:
P-value = (number of correct responses) / (Total Number of responses)Range: 0.0-1.0, where higher values indicate easier questions
Rasch Method: Item Response Theory approach using the Rasch model:
P(θ) = e^(θ - δ) / (1 + e^(θ - δ))Where:
- θ = person ability parameter
- δ = item difficulty parameter (logit scale)
- Range typically -3 to +3 logits (negative = easier, positive = harder)
Quality (Point Biserial): Discrimination index measuring how well each question differentiates between high and low performers:
r_pbis = (M_p - M_t) / S_t × √(p / (1-p))Where:
- M_p = Mean total score for examinees who got the item correct
- M_t = Mean total score for all examinees
- S_t = Standard deviation of total scores
- p = Proportion of examinees who got the item correct
Color-coded quality thresholds:
- Very Good (Green): r_pbis ≥ 0.40
- Good (Light Green): 0.30 ≤ r_pbis < 0.40
- Fairly Good (Yellow): 0.20 ≤ r_pbis < 0.30
- Marginal (Orange): 0.10 ≤ r_pbis < 0.20
- Poor (Red): r_pbis < 0.10
Analyzed Status: Visual indicators (✓/✗) showing completion of statistical analysis.
Advanced Calculations
Item-Total Correlation: Alternative discrimination measure:
r_it = Σ(X_i - X̄_i)(T - T̄) / √[Σ(X_i - X̄_i)² × Σ(T - T̄)²]Where X_i = item score and T = total test score
Rasch Item Fit Statistics:
- Infit Mean Square:
Infit MNSQ = Σ(W × Z²) / Σ(W) - Outfit Mean Square:
Outfit MNSQ = Σ(Z²) / n
Where Z = standardized residual and W = variance weight
Optimization Guidelines
Target Ranges for Quality Assurance:
- P-Value Optimal Range: 0.30-0.79
- Calculation:
Optimal P = 0.50 + (r_pbis / 2)for maximum discrimination
- Calculation:
- Rasch Difficulty Range: -0.5 to +0.5 logits
- Conversion:
Difficulty (logits) = ln(1-P / P)
- Conversion:
Item Response Function: For each item, the probability of correct response:
P(X = 1|θ, a, b, c) = c + (1-c) × e^(a(θ-b)) / (1 + e^(a(θ-b)))Where:
- a = discrimination parameter
- b = difficulty parameter
- c = guessing parameter (for multiple choice)
Color Coding Algorithm
The interface applies color coding based on statistical thresholds:
- Gray shading: Values outside optimal psychometric ranges
- Blue shading: Values within acceptable parameters
- Quality colors: Based on point biserial correlation ranges as specified above
This dashboard enables rapid identification of items requiring revision through automated flagging of statistical outliers and suboptimal psychometric properties.