- Associated Instructional Materials:
Question Reliability is a psychometric measure that quantifies the consistency and dependability of assessment questions within OnTarget. It indicates how reliably a set of questions measures the intended construct or subject area, with values ranging from 0 (least reliable) to 1 (most reliable).
Technical Interpretation
Reliability Scale
- Range: 0.0 to 1.0 (displayed as decimal values)
- 0.0: Questions show no consistency or reliability
- 1.0: Questions demonstrate perfect reliability and consistency
- Acceptable Threshold: Generally, reliability coefficients above 0.7 are considered acceptable for educational assessments
Mathematical Foundation
Cronbach’s Alpha Formula
The reliability coefficient shown is calculated using Cronbach’s Alpha (α):
α = (k/(k-1)) × (1 - (Σσ²ᵢ/σ²ₜ))Where:
- k = number of questions/items in the test
- σ²ᵢ = variance of individual question scores
- σ²ₜ = variance of total test scores
- Σσ²ᵢ = sum of all individual question variances
Alternative Correlation-Based Formula
α = (k × r̄)/(1 + (k-1) × r̄)Where:
- k = number of questions
- r̄ = average inter-item correlation
Technical Interpretation & Calculations
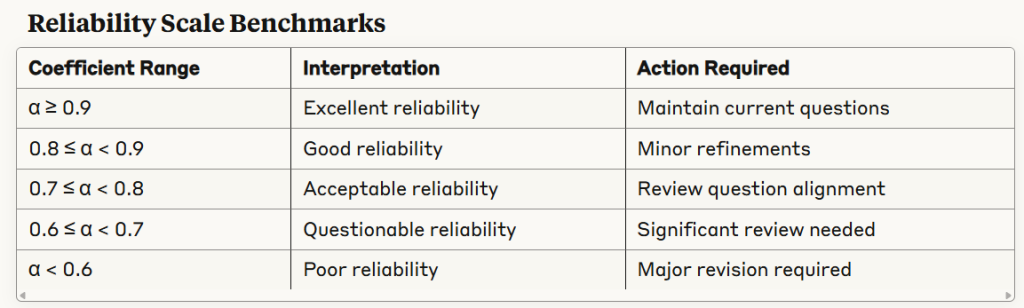
Chart Analysis with Calculations
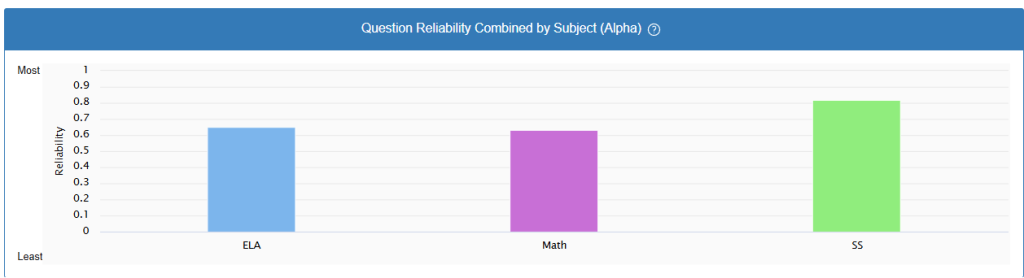
Based on the displayed values:
ELA and Math: α ≈ 0.6
- Reliability Status: Questionable
- Measurement Error: SE = σ√(1-α) = σ√(1-0.6) = σ × 0.632
- Confidence: 60% of variance attributed to true score differences
Social Studies (SS): α ≈ 0.8
- Reliability Status: Good
- Measurement Error: SE = σ√(1-α) = σ√(1-0.8) = σ × 0.447
- Confidence: 80% of variance attributed to true score differences
Standard Error of Measurement (SEM)
SEM = σ × √(1 - α)Practical Example: If a Math test has:
- Standard deviation (σ) = 15 points
- Reliability (α) = 0.6
Then: SEM = 15 × √(1 – 0.6) = 15 × 0.632 = 9.48 points
This means individual scores could vary by ±9.48 points due to measurement error alone.
Confidence Intervals for True Scores
True Score Range = Observed Score ± (Z × SEM)For 95% confidence: Z = 1.96 For 68% confidence: Z = 1.00
Example: Student scores 75 on Math test (α = 0.6, σ = 15)
- SEM = 9.48
- 95% CI: 75 ± (1.96 × 9.48) = 56.4 to 93.6
Quality Improvement Calculations
Required Sample Size for Reliability Studies
n ≥ (Z²α/2 × (1-α)²)/(E² × α²)Where E = acceptable margin of error
Item-Total Correlation Threshold
Questions should typically show correlations ≥ 0.3 with total score:
rᵢₜ = (rᵢₓ - rₜₓ × rᵢₜ)/√((1-r²ₜₓ)(1-r²ᵢₜ))Practical Implications
Decision Matrix Based on Reliability Coefficients:
α ≥ 0.8 (Social Studies)
- Action: Maintain current question bank
- Confidence: High precision in student ability measurement
- Use Case: Suitable for high-stakes assessments
α = 0.6 (ELA, Math)
- Action: Review and enhance question alignment
- Confidence: Moderate precision, interpret scores cautiously
- Use Case: Acceptable for formative assessment, problematic for summative
This metric helps OnTarget users understand the measurement precision of their assessments and provides quantitative guidance for question bank optimization to improve testing reliability.