- Associated Instructional Materials
Definition
In psychometric analysis, the question difficulty p-value represents the proportion of test-takers who answered a question correctly. Unlike statistical hypothesis testing, this p-value ranges from 0.0 to 1.0 and serves as a direct measure of item difficulty.
Calculation Formula
The item difficulty p-value is calculated using the following formula:
P-value = (Number of correct responses) ÷ (Total number of responses)
Where:
- P-Value ranges from 0.00 to 1.00
- 0.00 = No one answered correctly (most difficult)
- 1.00 = Everyone answered correctly (easiest)
Example Calculations:
- If 75 out of 100 test-takers answer correctly: P-value = 75/100 = 0.75
- If 30 out of 100 test-takers answer correctly: P-value = 30/100 = 0.30
- If 95 out of 100 test-takers answer correctly: P-value = 95/100 = 0.95
Interpretation Scale
- P-value = 0.0: No test-takers answered correctly (extremely difficult)
- P-value = 0.5: 50% of test-takers answered correctly (moderate difficulty)
- P-value = 1.0: All test-takers answered correctly (extremely easy)
Distribution Analysis
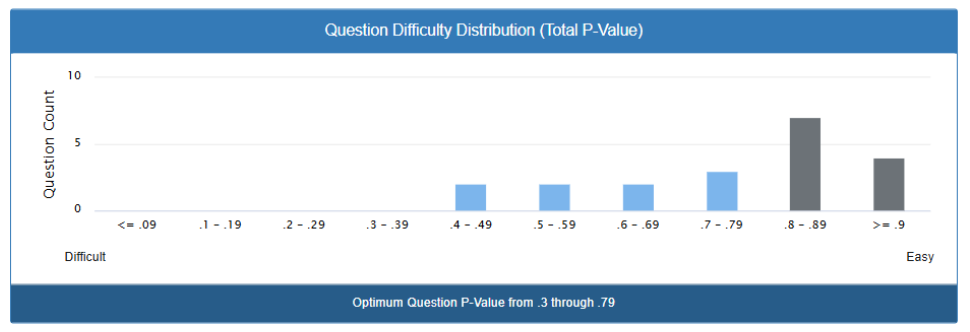
The screenshot displays a difficulty distribution histogram showing:
Difficulty Classification:
- ≤0.09: Extremely difficult questions (very few correct responses)
- 0.1-0.29: Difficult questions
- 0.3-0.49: Moderately difficult questions
- 0.5-0.69: Moderate difficulty questions
- 0.7-0.89: Easy questions
- ≥0.9: Very easy questions
Optimum Range Indicator: The highlighted section shows “Optimum Question P-Value from .3 through .79”, indicating the recommended difficulty range for effective assessment discrimination.
Observed Distribution Pattern:
The chart reveals a right-skewed distribution with:
- Peak concentration in the 0.8-0.89 range (~340 questions)
- Secondary peak at 0.7-0.79 range (~280 questions)
- Minimal questions in extremely difficult ranges (≤0.29)
Psychometric Significance
Optimal Difficulty Range (0.3-0.79):
- Provides maximum discrimination between high and low performers
- Ensures questions are neither too easy (ceiling effect) nor too difficult (floor effect)
- Supports reliable measurement across the ability spectrum
Distribution Quality Indicators:
- Balanced distribution: Questions spread across difficulty levels
- Concentration in optimal range: Most items fall within the 0.3-0.79 range
- Minimal extreme values: Few items at the very easy (>0.9) or very difficult (<0.3) extremes
Psychometric Rationale:
- Discrimination Power: Questions with P-values between 0.3-0.7 typically provide maximum discrimination between high and low performers
- Reliability: Items in this range contribute most effectively to test reliability
- Information Function: These difficulty levels provide optimal measurement precision
Statistical Considerations:
Item Discrimination Formula:
Point-Biserial Correlation = (Mean score of correct group - Mean score of total group) / Standard deviation of total scores × √(p/(1-p))Where optimal discrimination occurs when p ≈ 0.5, with acceptable ranges extending from 0.3-0.7.
Quality Implications
Current Distribution Assessment:
- Strength: Substantial number of questions (680+) in optimum range
- Concern: Heavy concentration in easy ranges (0.7-0.9) may indicate:
- Insufficient challenge for higher-ability examinees
- Potential ceiling effects
- Reduced ability to differentiate among high performers
Recommendations:
- Balance Enhancement: Increase proportion of questions in 0.3-0.6 range
- Ceiling Effect Mitigation: Reduce over-concentration in 0.8+ ranges
- Floor Effect Prevention: Maintain minimal presence of extremely difficult items (≤0.2)
Technical Applications
This P-value distribution data enables:
- Adaptive Testing: Item selection based on examinee ability estimates
- Test Equating: Maintaining consistent difficulty across test forms
- Content Validation: Ensuring appropriate cognitive demand distribution
- Performance Prediction: Estimating score distributions for planning purposes
The analysis suggests a test bank weighted toward easier items, which may be appropriate depending on the assessment’s purpose (certification vs. selection vs. diagnostic evaluation).