The Rasch model is a powerful psychometric framework that helps ensure your classroom assessments produce fair, reliable, and meaningful results. Unlike traditional scoring methods that simply count correct answers, the Rasch model creates interval-level measurements that allow for more sophisticated analysis of both student ability and item quality.
The Measurement Ruler Analogy
Think of the Rasch model as creating a special ruler that measures both students and test questions using the same scale. Imagine you have a ruler where:
- Student ability is marked on one side (like measuring height in inches)
- Item difficulty is marked on the other side (using the same inch markings)
- When a student’s ability level is “higher” than an item’s difficulty level, they’re likely to answer correctly
- When an item’s difficulty exceeds a student’s current ability, they’ll probably struggle with it
This shared measurement scale is what makes Rasch analysis so powerful – you can directly compare any student to any item, or any student to any other student, even if they never took the same test items. It’s like being able to say “Sarah is taller than the doorway” and “Tom is shorter than the doorway” even if Sarah and Tom were measured with different rulers, as long as both rulers used the same inch markings.
Difficulty Estimate graph
Traditional Problem: When you create a 20-question test, getting 15 questions correct doesn’t necessarily mean students have 75% mastery. Some questions might be much harder than others, making the raw score misleading.
Rasch Solution: The model places both students and test items on the same measurement scale, providing more accurate ability estimates and revealing which items truly assess your learning objectives.
What You’re Looking At
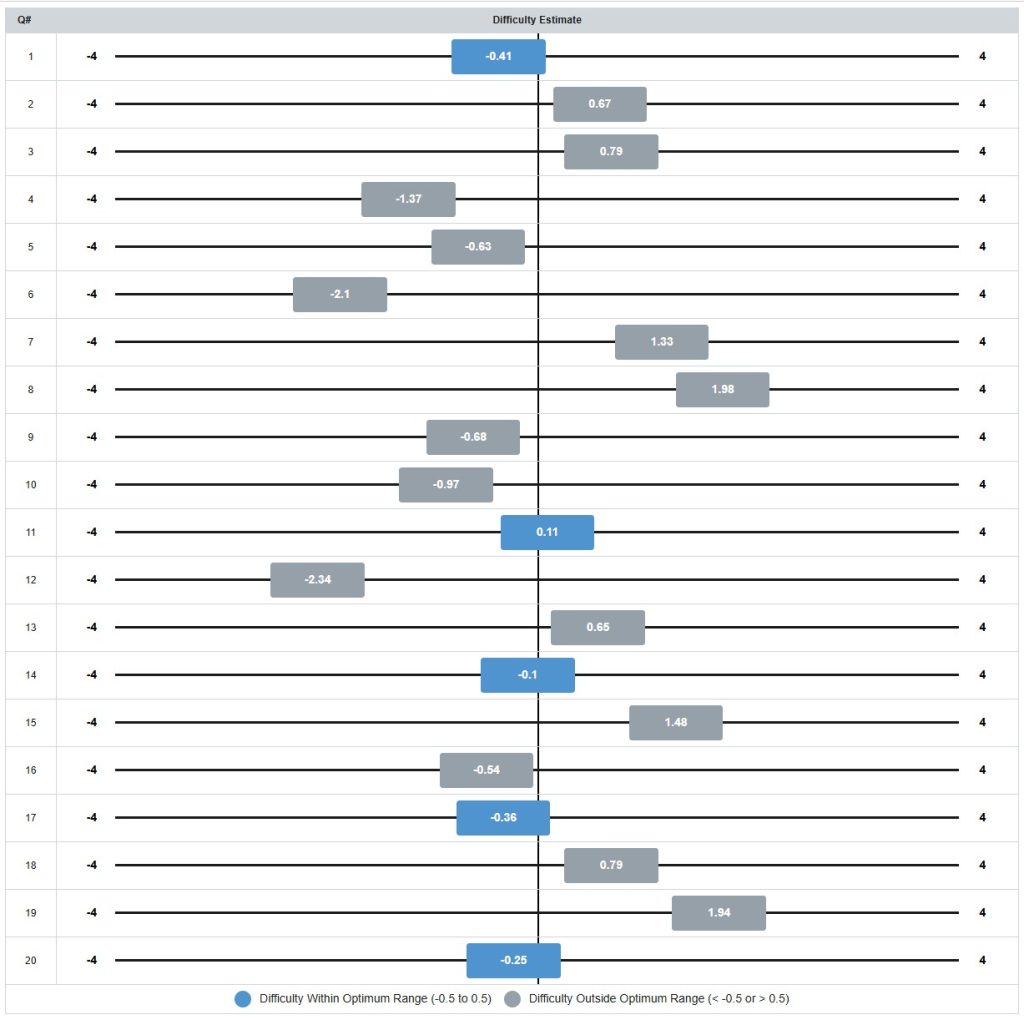
This chart shows the difficulty estimates for each of 20 test items on a logit scale (ranging from -4 to +4). The vertical line in the center represents 0 logits, which is typically set as the average difficulty level.
Reading the Chart
The Numbers in Each Box: These show how easy or hard each question was:
- Negative numbers (like -2.34) = Easier questions that most students got right
- Positive numbers (like +1.98) = Harder questions that fewer students got right
- Numbers close to 0 = Questions that were just right – not too easy, not too hard
The Colors Matter:
- Blue boxes = “Just right” questions that matched your students’ ability level well
- Gray boxes = Questions that might need attention (either too easy or too hard for your class)
Color Coding Analysis
Blue Items (Within Optimum Range: -0.5 to 0.5 logits):
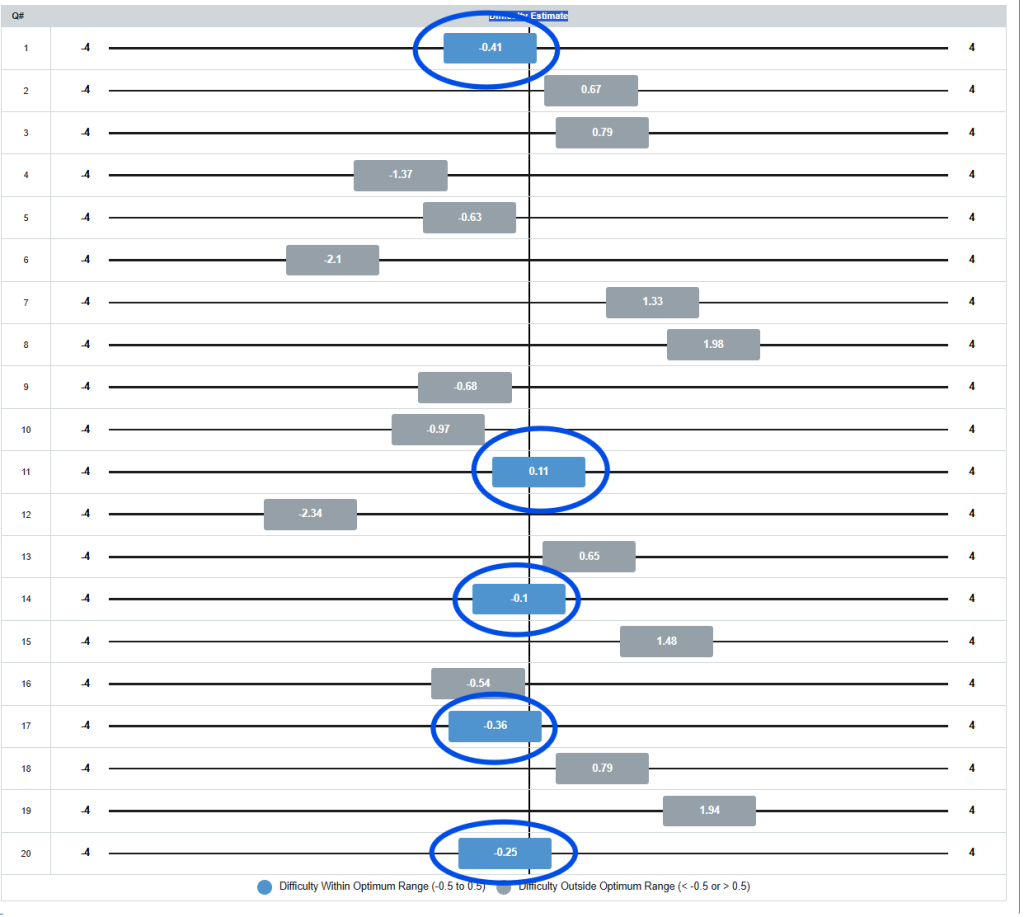
- Items 1, 11, 14, 17, and 20
- These 5 items (25% of your test) are well-targeted for your student population
- They provide maximum information and discrimination
Gray Items (Outside Optimum Range):
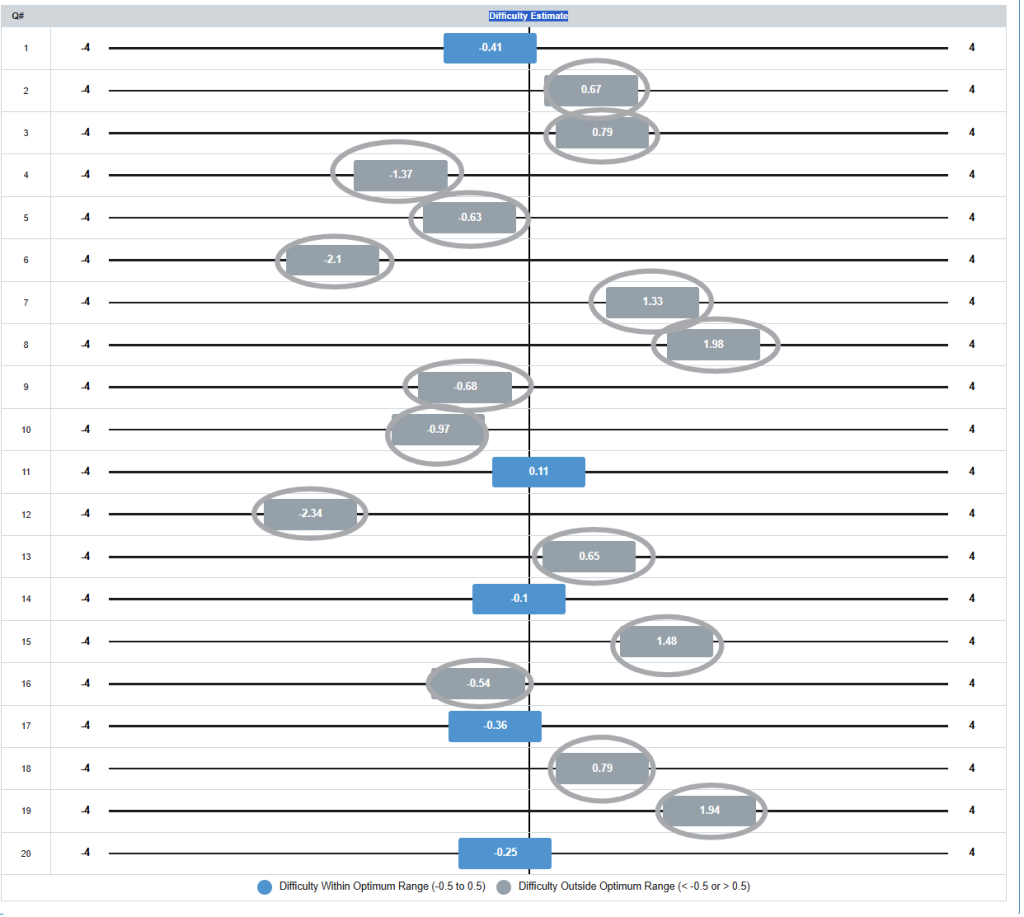
- 15 items (75% of your test) fall outside the optimal targeting range
Specific Item Analysis
Items That Are Too Easy (Negative values < -0.5):
- Item 6 (-2.1) and Item 12 (-2.34): Extremely easy – nearly all students likely answered correctly
- Items 4, 5, 9, 10, 16: Moderately too easy
- These items provide little information about student ability differences
Items That Are Too Hard (Positive values > 0.5):
- Item 8 (1.98) and Item 19 (1.94): Very difficult – few students likely answered correctly
- Items 2, 3, 7, 13, 15, 18: Moderately too hard
- These items may be frustrating and provide limited discrimination
What This Means for Your Teaching
The “Sweet Spot” Questions (Blue)
Questions 1, 11, 14, 17, and 20 are in the blue zone. These questions:
- Challenged your students appropriately
- Helped you distinguish between different ability levels
- Are worth keeping for future assessments
Questions to Review (Gray)
The gray questions fell outside the ideal range:
Too Easy (like Question 12 at -2.34):
- Almost everyone got these right
- Might not tell you much about student learning
- Consider making them slightly more challenging
Too Hard (like Question 8 at +1.98):
- Most students struggled with these
- May indicate content that needs more teaching time
- Could be rewritten to be more accessible
Actionable Recommendations
Immediate Actions:
- Review Items 6, 8, 12, and 19 – these show extreme difficulty values that suggest they may not be functioning as intended
- Consider removing or revising the most problematic items for future administrations
- Examine item content for items outside the optimum range to understand why they’re easier/harder than expected
Assessment Improvement:
- Add more items in the -0.5 to 0.5 range to improve targeting
- Revise overly easy items to increase their difficulty appropriately
- Simplify overly difficult items or provide more scaffolding
- Maintain items 1, 11, 14, 17, and 20 as they’re performing optimally
Targeting Implications:
- Your assessment appears to have a bimodal distribution with clusters of very easy and moderately difficult items
- This suggests the test may not be optimally targeted for your specific student population
- Consider whether this reflects intentional design (covering a wide ability range) or needs adjustment
Questions to Investigate:
- Do the extremely easy items (6, 12) assess foundational skills all students should master?
- Are the very difficult items (8, 19) measuring advanced concepts or are they poorly written?
- Does your intended construct require this wide range of difficulty, or should items be more tightly clustered around student ability levels?
The Bottom Line
This analysis helps you create better assessments by showing which questions work well for your students’ current ability level. The goal is to have most of your questions in that blue “just right” zone where they’re challenging but fair.
Think of it like Goldilocks and the Three Bears – you want questions that are not too easy, not too hard, but just right for helping your students learn and grow!