This is a breakdown of the assessment you are taking a deeper dive into, which includes total questions, question reliability, average raw score, standard deviation, average question difficulty p-value, question difficulty Rasch, and average question quality point biserial
Interpreting the example provided
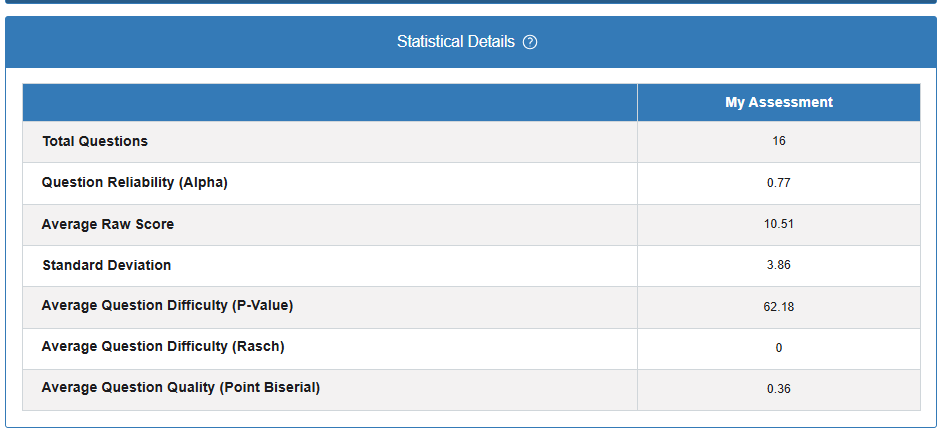
This report provides a breakdown of key statistical indicators for a 16-question assessment:
- Total Questions:
The assessment includes 16 questions in total. - Question Reliability (Alpha):
The assessment’s reliability, measured using Cronbach’s Alpha, is 0.77. This suggests moderate to strong internal consistency, indicating that the items generally measure the same underlying construct. - Average Raw Score:
The mean score achieved by students is 10.51 out of 16, suggesting that most students answered about two-thirds of the questions correctly. - Standard Deviation:
A standard deviation of 3.86 shows how much student scores vary around the average. A higher value indicates more spread in the scores. - Average Question Difficulty (P-Value):
The P-value is 62.18, meaning that, on average, 62% of students answered each question correctly, reflecting moderate difficulty. - Average Question Difficulty (Rasch):
The Rasch difficulty value is 0, typically indicating the average item lies at the center of the difficulty scale in Rasch analysis. - Average Question Quality (Point Biserial):
The Point Biserial correlation is 0.36, which is considered acceptable to good. This means that questions are generally doing a decent job of distinguishing between higher- and lower-performing students.