👥 What is Overall Student Performance by Demographics?
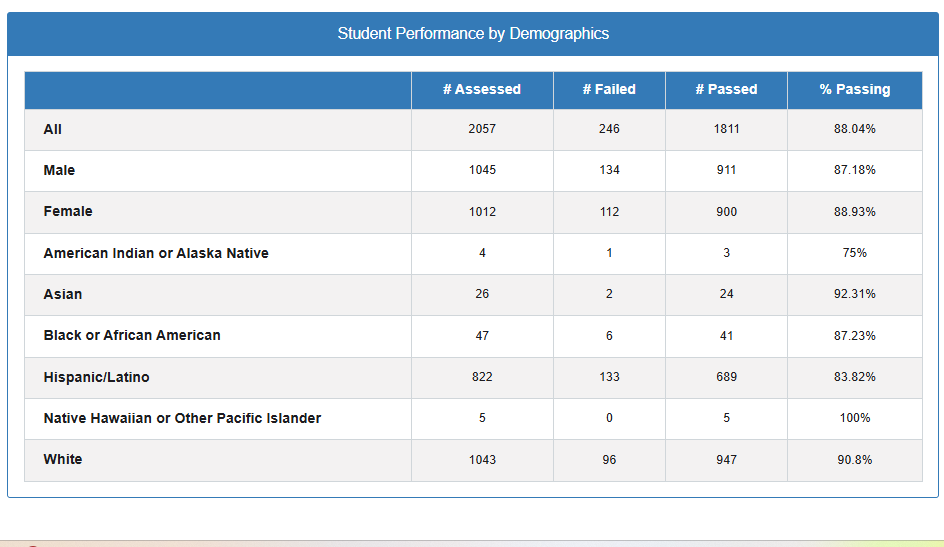
This report shows how different student groups performed on assessments — broken down by demographic categories like:
- Ethnicity/Race
- Gender
In relation to how they did:
- Number Assessed
- Number Failed
- Number Passed
- Percent Passing
Key Observations
What the Numbers Are Really Showing: Think of this assessment like a thermometer – it’s supposed to measure what your students know, but just like a broken thermometer might give different readings in different rooms, this test might be measuring things differently for different groups of students.
The Pattern You’re Seeing:
- Your Hispanic/Latino students (who make up almost half your school) are passing at 83.8% while Asian students are passing at 92.3%
- This 8-point gap is bigger than you’d expect if the test was working the same way for everyone
- The gender difference (1.75 points) is small enough that it’s probably not a big concern
- Some groups have so few students (like only 4 American Indian students) that their percentages don’t tell us much
Peak Considerations
Why This Pattern Matters: When you see patterns like this across large groups, it’s usually the test, not the students. The Hispanic/Latino students aren’t less capable – the test might just not be showing their true abilities.
What Could Be Going Wrong:
- Questions might use cultural references some students don’t know (like asking about snow skiing in a community where most kids have never seen snow)
- Language might be unnecessarily complex, testing reading ability instead of the actual subject
- Examples might not connect to all students’ life experiences
- The test might be measuring cultural familiarity instead of actual knowledge
Implications for Assessment Quality
What This Data Suggests About the Test: This pattern indicates the assessment may not be providing an accurate picture of what all students actually know and can do.
Fairness Concerns:
- The test might be unfairly disadvantaging certain groups of students
- Large performance gaps between demographic groups suggest the test may not be measuring the same thing for everyone
- This could lead to incorrect conclusions about student abilities and needs
Reliability Issues:
- When a test works differently for different groups, we can’t trust that it’s measuring consistently
- The small sample sizes for some groups make it hard to know if their results are meaningful
- Score comparisons between demographic groups may not be valid
Actionable Recommendations
For Test Analysis:
- Review test content – Check if questions use examples that make sense to all student groups
- Examine language complexity – Look for unnecessarily difficult wording that might confuse students
- Analyze cultural references – Identify items that might favor students from certain backgrounds
For Data Interpretation:
- Use caution with comparisons – Don’t assume demographic differences reflect actual ability differences
- Look for patterns – When large groups consistently underperform, investigate the test rather than the students
- Consider multiple measures – Use various assessments to get a complete picture of student learning
Immediate Assessment
Questions to Investigate:
- How was this test developed and by whom?
- Was it reviewed for potential bias before being used?
- Have similar patterns appeared in other schools or districts?
- What other data sources can provide insight into student performance?
Action Items:
- Review the actual test questions for potential bias
- Look at item-level data to see which specific questions show the biggest demographic gaps
- Compare these results to other assessments or measures of student achievement
Future Test Development
What Better Test Development Looks Like:
During Test Creation:
- Tests should be reviewed by people from different backgrounds before being used
- Questions should use examples that make sense to all students
- Tests should be tried out with diverse groups of students first
Ongoing Monitoring:
- Regular analysis of performance by demographic groups
- Systematic review and revision of problematic test items
- Training for test developers on creating fair assessments
Quality Assurance:
- Establish clear standards for acceptable performance gaps between groups
- Create processes for investigating and addressing bias when it’s detected
- Involve community stakeholders in test review processes