- Associated Instructional Materials
P-Value tells you how many students got a question right. Think of it as a “success rate” for each question on your test or assessment.
- Low P-Value (0.1-0.3): Very few students got it right = Hard question
- Medium P-Value (0.4-0.6): About half the students got it right = Medium difficulty
- High P-Value (0.7-0.9): Most students got it right = Easy question
Formula and Calculation
P-Value = (Number of Correct Responses) / (Total Number of Responses)
Where:
- P-Value ranges from 0.00 to 1.00
- 0.00 = No one answered correctly (most difficult)
- 1.00 = Everyone answered correctly (easiest)
Reading the Chart
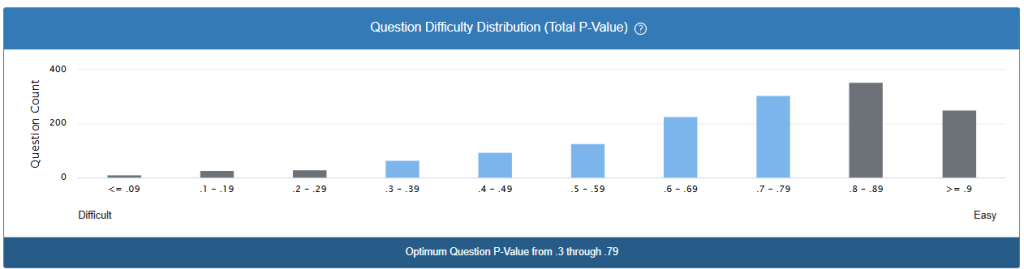
What the Numbers Mean:
- Left side (Difficult): Questions that most students struggle with
- Middle: Questions that challenge students but are fair
- Right side (Easy): Questions that most students can answer correctly
What This Chart Shows:
- Most questions (the tall bars on the right) are on the easier side
- There are very few extremely difficult questions
- The majority of questions have success rates between 70-90%
The “Sweet Spot”:
The shaded area (0.3 through 0.79) represents the ideal range where questions are most useful for understanding what students know. Questions in this range help you:
- Identify which students need extra support
- Recognize which students are ready for enrichment
- Plan your next lessons effectively