- Associated Instructional Materials
Definition (Assessment Context): p-value = proportion of students who answered the item correctly. It ranges from 0 to 1:
A low p-value (close to 0) = the item is hard (few students got it right)
A high p-value (close to 1) = the item is easy (many students got it right)
🧪 How to Interpret Assessment P-Values:
| p-value Range | Interpretation |
|---|---|
| 0.85 – 1.00 | Very easy item |
| 0.60 – 0.84 | asy item |
| 0.40 – 0.59 | Moderate difficulty |
| 0.20 – 0.39 | Difficult item |
| 0.00 – 0.19 | Very difficult item |
Example: If an item has a p-value of 0.65, that means 65% of students got it correct—so it’s considered an easy to moderate item.
In OnTarget, there is a visual representation on the dashboard and within each test to show the overall P-Value from difficult to easy.
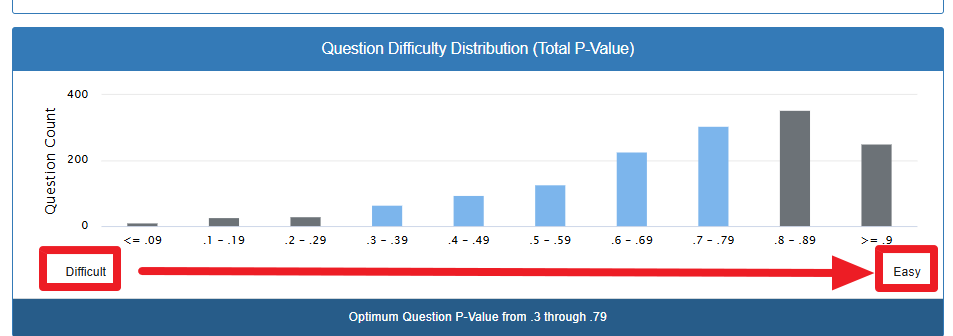
The key insight: The blue box at the bottom highlights the “sweet spot” – questions with P-values between 0.3 and 0.79. These are considered optimal because:
- They’re not so easy that everyone gets them right (which doesn’t help you assess learning)
- They’re not so hard that almost everyone gets them wrong (which can be discouraging)
- They help you differentiate between students who have mastered the material and those who need more support
📌 Why It Matters:
Balance: A well-constructed test has a mix of easy, moderate, and difficult items.
Too many high p-values: The Test may be too easy and not challenging enough.
Too many low p-values: This may frustrate students or not reflect instruction.
Helps with validity and item revision