This report analyzes how well your test questions are working for your students during a particular year (in this case 2022-23 school year). Think of it as a report card for your test questions – it tells you which ones are helping you accurately measure what your students know and which ones might be confusing or unfair.
📘 Breaking Down the Numbers
🧾 What does it include?
Here’s what you’ll see in the Overall Metrics by Year report:
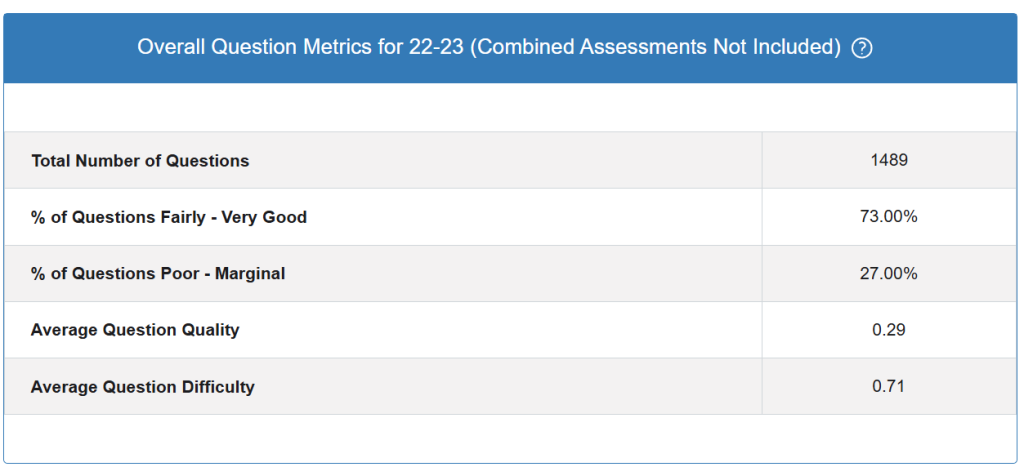
- Total Number of Questions
- % of Questions Fairly-Very Good
- % of Questions Poor to Marginal
- Average Question Quality
- Average Question Difficulty
Key Findings
Question Quality Distribution
73% of questions are “Fairly Good” to “Very Good”
This means about 3 out of every 4 questions on your tests are working well. These questions:
- Clearly distinguish between students who understand the material and those who don’t
- Are written at an appropriate level for your students
- Have answer choices that make sense
27% of questions are “Poor” to “Marginal”
About 1 out of every 4 questions needs improvement. These questions might:
- Confuse even students who know the material
- Have unclear wording or tricky answer choices
- Be too easy or too hard for most students
Quality and Difficulty Scores
Average Question Quality: 0.29
This number tells you the overall quality of your questions on a scale where higher numbers mean better quality. Your current score suggests there’s significant room for improvement in how your questions are written and designed.
Average Question Difficulty: 0.71
This shows how challenging your questions are for students. Your current level means your questions are quite difficult – most students are getting them wrong. While challenging questions aren’t necessarily bad, you want a good mix of difficulty levels to accurately assess all your students.
What This Means for Your Classroom
The Good News
- Most of your questions (73%) are doing their job well
- You’re creating assessments that challenge your students
- You have solid data to guide improvements
Areas to Focus On
Question Writing: About 1 in 4 of your questions could be clearer or more fair. Look for questions where:
- Good students consistently choose wrong answers
- The wording is confusing or has multiple interpretations
- Answer choices don’t clearly connect to the learning objective
Difficulty Balance: Your questions might be too challenging overall. Consider:
- Including some easier questions to build student confidence
- Making sure questions match what you actually taught in class
- Checking that vocabulary and reading level are appropriate
Next Steps for Improvement
- Review your “poor” questions first – these are the ones that aren’t working well for anyone
- Ask colleagues to review confusing questions – a fresh pair of eyes can spot unclear wording
- Check if your questions match your teaching – make sure you’re testing what you actually covered in class
- Consider student feedback – if multiple students found a question confusing, they might be right
This type of data analysis helps you make informed decisions about refining your assessments to better support student learning and provide more accurate measures of student understanding.
Remember, even experienced teachers regularly revise their questions. This data is a helpful tool to make your assessments more fair and accurate for your students!