- Associated Instructional Materials
What is a P-Value?
The p-value for a test question shows how many students got that question right. It’s simply a number between 0 and 1 that tells you if a question was easy or hard for your class.
How to Calculate It
P-value = (Students who got it right) ÷ (Total students who took the test)
Real Classroom Examples:
- 20 out of 25 students answer correctly: P-value = 20/25 = 0.80 (easy question)
- 10 out of 25 students answer correctly: P-value = 10/25 = 0.40 (medium difficulty)
- 5 out of 25 students answer correctly: P-value = 5/25 = 0.20 (hard question)
What the Numbers Mean
- 0.0 to 0.3: Very hard questions (most students got it wrong)
- 0.3 to 0.7: Just right difficulty (good mix of right and wrong answers)
- 0.7 to 1.0: Very easy questions (most students got it right)
Reading the Chart
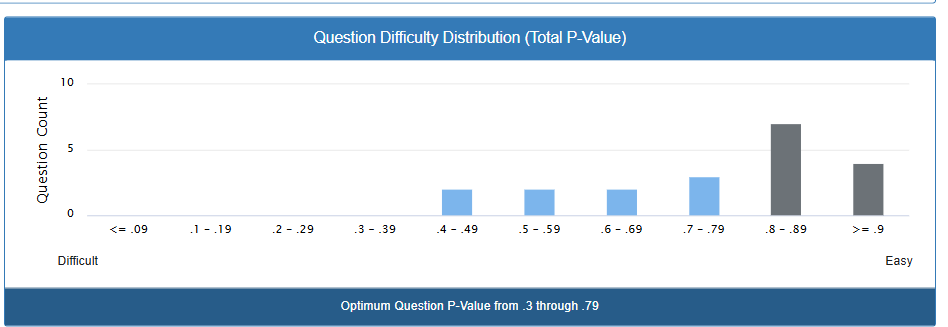
The chart shows how many questions fall into each difficulty range:
What the Numbers Mean
- P = 1.0 (or 100%): Everyone got it right – very easy question
- P = 0.8 (or 80%): Most students got it right – fairly easy question
- P = 0.5 (or 50%): Half the students got it right – medium difficulty
- P = 0.2 (or 20%): Few students got it right – hard question
- P = 0.0 (or 0%): No one got it right – very hard question
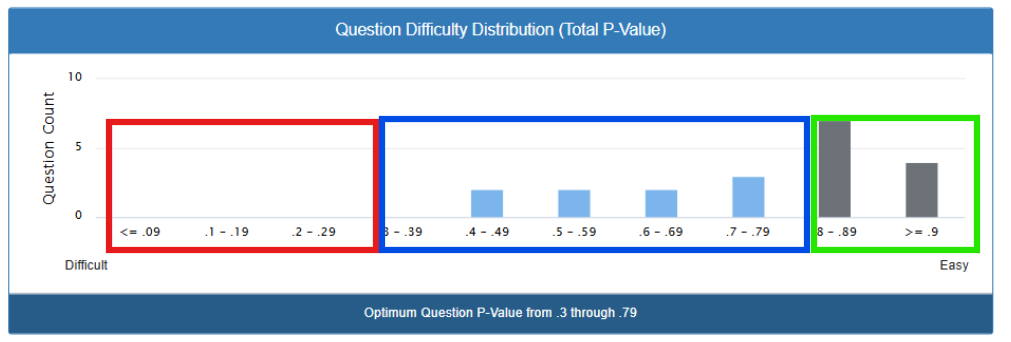
Left side (red, Difficult): Questions that stumped most students
Middle section (blue): Questions with good difficulty – not too easy, not too hard
Right side (green, Easy): Questions most students found simple
Similar to the dashboard, this question difficulty distribution shows the same info but for an individual test.
The Ideal Distribution
What You Want to See
- Some easy questions (P = 0.8-1.0): Build confidence, check basic understanding
- Most questions in the middle (P = 0.3-0.7): Measure typical learning, good for discriminating between students
- Some challenging questions (P = 0.0-0.3): Identify advanced students
- Balanced coverage across all difficulty levels
What This Means for Your Assessment
Strengths
✅ Good foundation: You have 9 questions (45%) in the optimal discrimination range
✅ No impossible questions: Nothing with P-values below 0.3
✅ Reasonable spread: Questions cover P = 0.4 to P = 0.9+
Areas of Concern
⚠️ Too many easy questions: 11 questions (55%) are too easy (P ≥ 0.8)
⚠️ Limited challenge: No questions harder than P = 0.4
⚠️ Ceiling effects: Many students likely scored very high, making it hard to distinguish ability levels
Impact on Student Assessment
What Students Experience:
- High scores across the board: Most students probably got 80%+ correct
- Limited differentiation: Hard to tell difference between good and excellent students
- Confidence building: Students likely felt successful (which can be positive)
What You Miss:
- Advanced learners: Can’t identify students ready for enrichment
- Fine distinctions: Difficulty separating students into ability groups
- Growth measurement: Hard to track improvement when scores are already high
Why This Matters for Your Teaching
The Sweet Spot (0.3 to 0.7):
- These questions help you see which students really understand the material
- They’re not so easy that everyone gets them right
- They’re not so hard that everyone gets them wrong
- They give you the best information about student learning
What to Look For:
- Good balance: You want questions spread across different difficulty levels
- Most questions in the middle: The highlighted “optimum” range shows the best difficulty for learning
- Few extremely easy or hard questions: These don’t tell you much about what students know
Specific Recommendations
Immediate Actions:
- Review the 4 questions with P ≥ 0.9: Are these testing important concepts or are they give-aways?
- Examine the 7 questions with P = 0.8-0.89: Could any be made slightly more challenging?
Future Test Development:
- Add challenging questions: Include 3-4 questions with P-values of 0.2-0.4
- Reduce very easy questions: Keep only 2-3 questions with P > 0.8 for confidence building
- Maintain your strong middle: Your P = 0.4-0.79 questions are working well
Questions to Consider
- Is this intentional? Are you focusing on mastery of basic skills?
- What’s your purpose? Is this a diagnostic, formative, or summative assessment?
- How does this align with your standards? Do the P-values match expected difficulty levels?
Next Steps
- Identify your top performers: Look at students who got 95%+ – what additional challenges do they need?
- Plan item revisions: Focus on making 3-4 of your easiest questions more challenging
- Consider your context: If this is early in the unit, easier questions might be appropriate
Using This Information
This data helps you understand if your test questions are at the right difficulty level to measure student learning effectively. Questions that are too easy or too hard don’t give you useful information about what your students have mastered.