👥 What is Overall Student Performance by Demographics?
This report shows how different student groups performed on assessments — broken down by demographic categories like:
- Ethnicity/Race
- Gender
In relation to how they did:
- Number Assessed
- Number Failed
- Number Passed
- Percent Passing
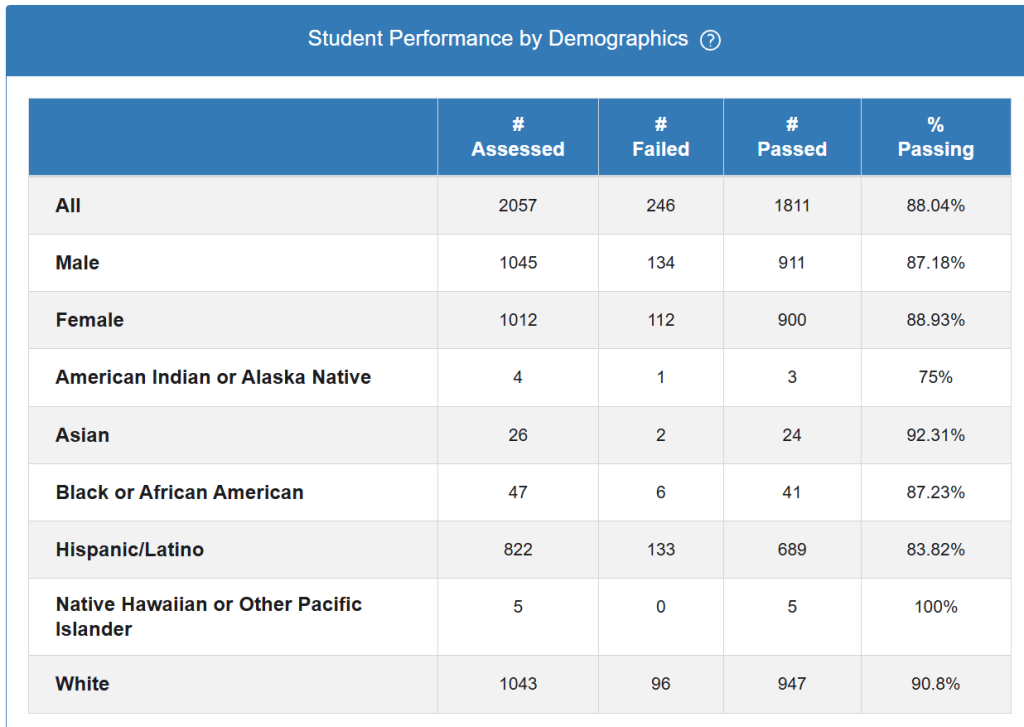
Overall Performance
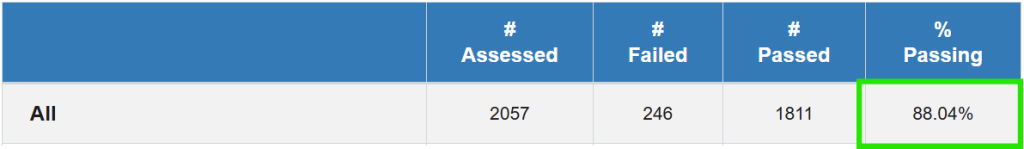
Your student population shows a strong overall passing rate of 88.04%, with 1,811 students passing out of 2,057 assessed. This indicates generally effective instruction and support systems.
Gender Patterns
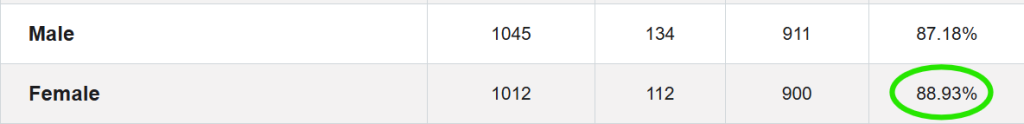
Female students show a slightly higher passing rate (88.93%) compared to male students (87.18%). This 1.75 percentage point difference aligns with national trends where female students often demonstrate slightly higher academic achievement in many subjects.
Racial and Ethnic Performance Variations
The data reveals important performance differences across racial and ethnic groups:
Higher-performing groups:
- Native Hawaiian/Pacific Islander students achieved 100% passing (though this represents only 5 students)
- White students: 90.8% passing rate
- Asian students: 92.31% passing rate
Groups needing additional support:
- Hispanic/Latino students: 83.82% passing rate (the largest demographic group with 822 students)
- Black/African American students: 87.23% passing rate
- American Indian/Alaska Native students: 75% passing rate (very small sample of 4 students)
Key Considerations for Your Teaching Practice
Sample Size Matters:
Be cautious interpreting results for very small groups. The American Indian/Alaska Native and Native Hawaiian/Pacific Islander groups have fewer than 10 students each.
Achievement Gaps:
The data shows performance gaps that reflect broader educational equity challenges. Hispanic/Latino students, who represent your largest minority group, are performing about 4 percentage points below the overall average.
Action Steps
Consider targeted interventions, culturally responsive teaching practices, and additional support systems for groups showing lower performance rates. Remember that these statistics represent individual students who may benefit from differentiated instruction and support.
This data should inform your planning while avoiding assumptions about individual student capabilities based on demographic characteristics.