
The OnTarget question analysis report is considerably different than what is being offered by most other software systems. Question analysis is a method of statistically reviewing items on a test to ensure that every question meets minimum quality control criteria. This statistical analysis is conducted after the test has been administered. Question analyses are conducted to review the quality and difficulty of the items.
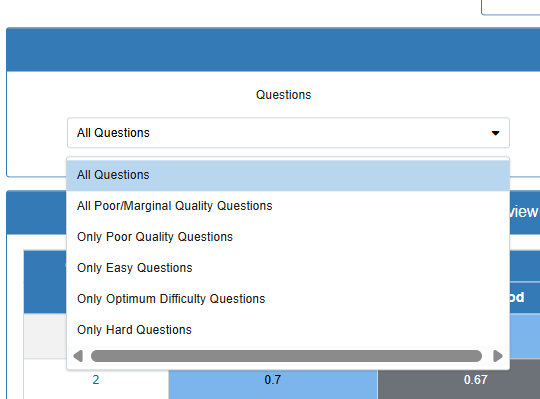
There are three different ways to dig deeper or analyze the questions
- Looking at all questions or by quality such as poor questions only
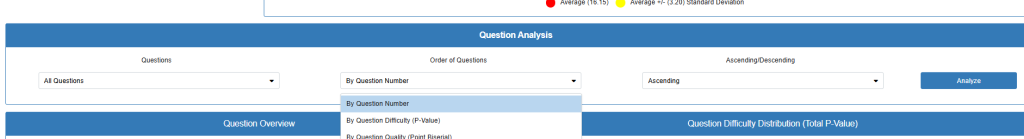
2. By Question Number, Question Difficulty, or Question Quality
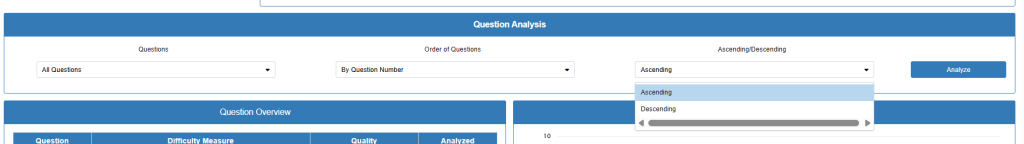
3. Ascending or Descending Order
After deciding which way to analyze, it is time to dig deeper into each question either as a team, PLC, or individually. On the left is a section for input while going through the question analysis, identifying what action was taken, or keeping notes for future reference.
Sample Question Analysis Report
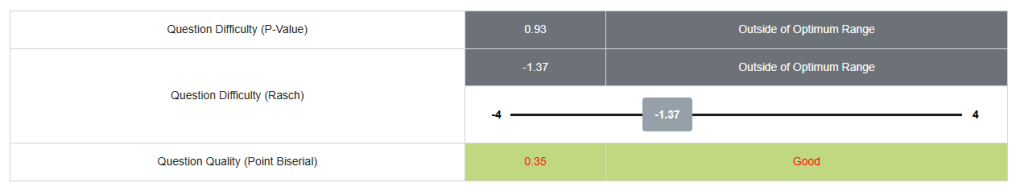
This Question Analysis report provides these three key metrics that indicate how well this particular test question performed. Here’s what each measurement means:
Question Difficulty (P-Value)
0.93 This means 93% of students answered this question correctly. In general:
- P-values range from 0.00 to 1.00
- 0.50 (50% correct) is considered ideal difficulty
- 0.30-0.70 is the optimum range for most classroom assessments
- The 0.93 indicates this question was too easy – almost everyone got it right
Question Difficulty (Rasch)
-1.37 This is another way to measure difficulty using a different scale:
- The scale typically runs from -4 to +4
- Negative numbers = easier questions
- Positive numbers = harder questions
- 0 = moderate difficulty
- The -1.37 confirms the question was quite easy
Question Quality (Point Biserial)
0.35 This measures how well the question distinguishes between high and low-performing students:
- Values range from -1.00 to +1.00
- Higher positive values are better
- 0.30+ is generally considered “good”
- The 0.35 means students who scored well overall were more likely to get this question right, which is what you want
What this means
This question worked well to identify student understanding (good quality), but it was too easy to provide meaningful assessment data. Consider making future similar questions slightly more challenging while maintaining the clear distinction between concepts that made this one high-quality.
Evidence of Validity
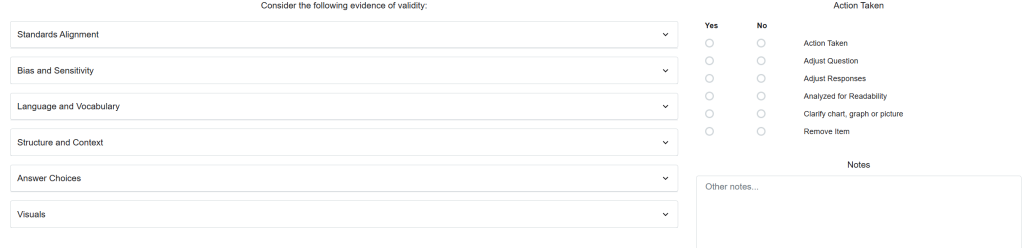
This is a validity review checklist used to systematically evaluate test questions to ensure they’re fair, accurate, and appropriately constructed. Here’s what each section helps you examine:
Standards Alignment
- Verifies the question actually measures what it’s supposed to measure
- Ensures it aligns with specific learning standards or objectives
- Confirms the question matches the intended grade level and content area
- State Standards: Does it match your curriculum requirements?
- Depth of Knowledge (DOK): Does the cognitive demand match your learning objective?
- DOK 1: Recall facts (identify, list)
- DOK 2: Apply skills/concepts (describe, compare)
- DOK 3: Strategic thinking (analyze, evaluate)
- DOK 4: Extended thinking (synthesize, create)
Example issue: Teaching students to “analyze” but asking them to only “identify” creates a mismatch.
Bias and Sensitivity
- Checks for cultural, gender, socioeconomic, or other biases
- Ensures the question doesn’t favor certain groups of students
- Reviews for potentially offensive or insensitive content
- Looks for assumptions about student backgrounds or experiences
This protects all students from unfair disadvantages:
- Cultural bias: Avoid references that favor certain backgrounds (e.g., assuming all students know about skiing)
- Stereotypes: Don’t reinforce harmful assumptions about groups
- Sensitive topics: Avoid emotionally charged content unrelated to learning objectives
Example issue: A math word problem about expensive vacations may disadvantage students from low-income families.
Language and Vocabulary
- Evaluates whether the reading level is appropriate
- Checks for unnecessarily complex or confusing language
- Ensures vocabulary doesn’t create barriers unrelated to the content being tested
- Reviews for clear, concise wording
This ensures language doesn’t become a barrier to demonstrating knowledge:
- Grade-appropriate vocabulary: Use words students at this level should know
- Clear, concise writing: Eliminate unnecessary complexity
- Consistent terminology: Don’t switch between “rectangle” and “quadrilateral” randomly
- Active voice: “Students conducted the experiment” vs. “The experiment was conducted by students”
Example issue: Using “precipitation” instead of “rain” in a 2nd-grade science question.
Structure and Context
- Examines the overall organization and flow of the question
- Checks if the context/scenario is realistic and relevant
- Ensures the question format supports the learning objective
- Reviews for logical progression of information
This ensures the question format supports learning assessment:
- Clear instructions: Students understand what they’re being asked to do
- Appropriate context: Scenarios are realistic and relevant
- No unintended clues: The structure doesn’t give away the answer
- Parallel structure: All answer choices follow the same format
Example issue: Making the correct answer noticeably longer than the distractors.
Answer Choices (for multiple choice questions)
- Evaluates whether distractors are plausible but clearly incorrect
- Checks that the correct answer is definitively right
- Ensures choices are similar in length and complexity
- Reviews for “all of the above” or “none of the above” issues
This ensures multiple-choice questions work effectively:
- Plausible distractors: Wrong answers should reflect common misconceptions
- Grade-level appropriate: Distractors based on content students should know
- Avoid “gotcha” answers: Don’t trick students who actually know the material
- One clearly correct answer: No ambiguity about which choice is right
Example issue: Having distractors like “purple elephant” that no student would reasonably choose.
Visuals
- Checks charts, graphs, images, or diagrams for clarity
- Ensures visuals support rather than confuse the question
- Reviews for appropriate size, resolution, and labeling
- Confirms visuals are accessible to all students
This ensures graphics support rather than hinder assessment:
- Purpose-driven: Charts/images directly support the question’s objective
- Complete information: Everything needed to answer is provided
- Clear and legible: Students can easily read and interpret visuals
- Accessible: Works for students with visual processing differences
Example issue: Including a blurry graph where students can’t read the numbers on the axes.
How to Use This Checklist
- Review each question systematically through all six lenses
- Mark “No” for any area that needs improvement
- Revise the question before using it with students
- Document your changes for future reference
- Build a bank of validated questions over time
This process might seem time-consuming initially, but it prevents the much larger problem of making instructional decisions based on invalid assessment data. Start with the most important assessments (unit tests, benchmarks) and gradually work through each question bank.
Here’s why this matters so much
Analyzing assessments for validity is critical for ensuring tests actually do what they’re supposed to do.
Validity ensures the assessment actually measures the intended learning objectives, not unrelated factors like reading ability when testing math concepts, or cultural knowledge when testing science skills. Without validity, one might think a student doesn’t understand fractions when they actually just struggled with complex vocabulary.