- Associated Instructional Materials
📘 What is Question Difficulty Distribution?
This report shows how easy or hard your test questions were for students — based on how many students got each question right. This is on the Dashboard of OnTarget and represents all questions based on the tests that have been loaded.
It helps you quickly see the spread of question difficulty across an assessment (or multiple assessments), so you can evaluate how balanced and effective your test is.
How is difficulty measured?
It’s based on the p-value of each question:
p-value = proportion of students who answered the question correctly
- A high p-value means the question was easy (lots of students got it right).
- A low p-value means the question was hard (fewer students got it right).
What is P-Value in Simple Terms?
P-Value tells you how many students got a question right. Think of it as a “success rate” for each question on your test or assessment.
- Low P-Value (0.1-0.3): Very few students got it right = Hard question
- Medium P-Value (0.4-0.6): About half the students got it right = Medium difficulty
- High P-Value (0.7-0.9): Most students got it right = Easy question
Reading the Chart
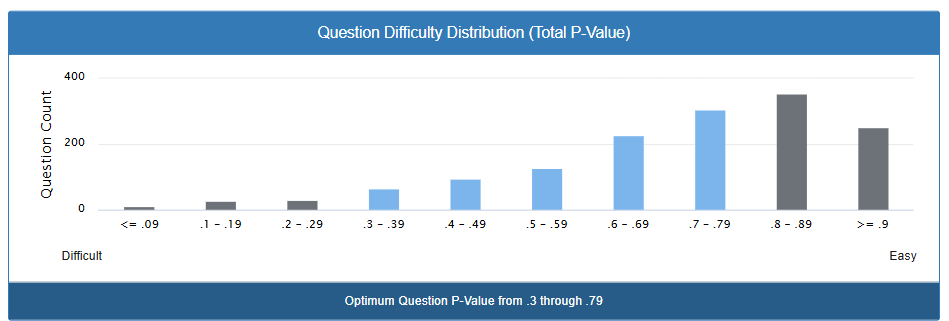
Looking at this chart, you can see how many questions fall into each difficulty level:
What the Numbers Mean:
- Left side (Difficult): Questions that most students struggle with
- Middle: Questions that challenge students but are fair
- Right side (Easy): Questions that most students can answer correctly
What This Chart Shows:
- Most questions (the tall bars on the right) are on the easier side
- There are very few extremely difficult questions
- The majority of questions have success rates between 70-90%
What the bars tell you:
The height of each bar shows how many questions you have at each difficulty level. Looking at your data:
- You have very few extremely difficult questions (left side)
- You have the most questions in the “moderately easy” range (P-value 0.8-0.89)
- You have a good number of medium-difficulty questions
- You have fewer extremely easy questions
What This Means for Your Classroom
The Good News:
- Students are generally succeeding on most questions
- The material seems to be at an appropriate level for most learners
- Students likely feel confident about their performance
Things to Consider:
- For Advanced Students: The high number of easy questions might not challenge your strongest students enough
- For Assessment Balance: A good test usually has a mix of easy, medium, and harder questions
- For Learning Growth: Students need some challenging questions to stretch their thinking
Practical Tips for New Teachers
Creating Balanced Assessments:
- Start Easy: Include some questions most students can answer to build confidence
- Include Challenge: Add medium-difficulty questions to assess understanding
- End Thoughtfully: Include a few harder questions for students ready to extend their learning
The “Sweet Spot”:
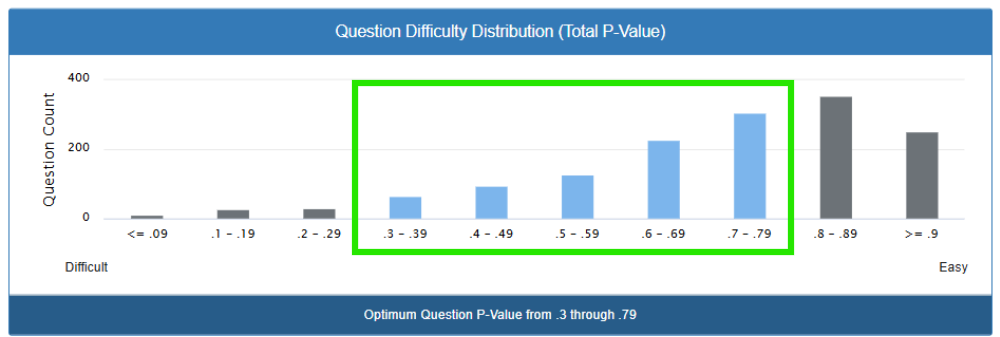
The shaded area (0.3 through 0.79) represents the ideal range where questions are most useful for understanding what students know. Questions in this range help you:
- Identify which students need extra support
- Recognize which students are ready for enrichment
- Plan your next lessons effectively
Bottom Line for Teachers
This chart suggests that while students are doing well overall, you might want to include more moderately challenging questions in future assessments. This will help you better understand the full range of your students’ abilities and provide more targeted instruction for everyone in your classroom.
Remember: The goal isn’t to make tests harder just to be difficult, but to create assessments that give you clear information about what each student has learned and what they’re ready to learn next.