The Question Overview is your quality control center for test questions. It shows you how well each question is working and helps you identify which ones need improvement before giving the test to your students.
Understanding the Columns
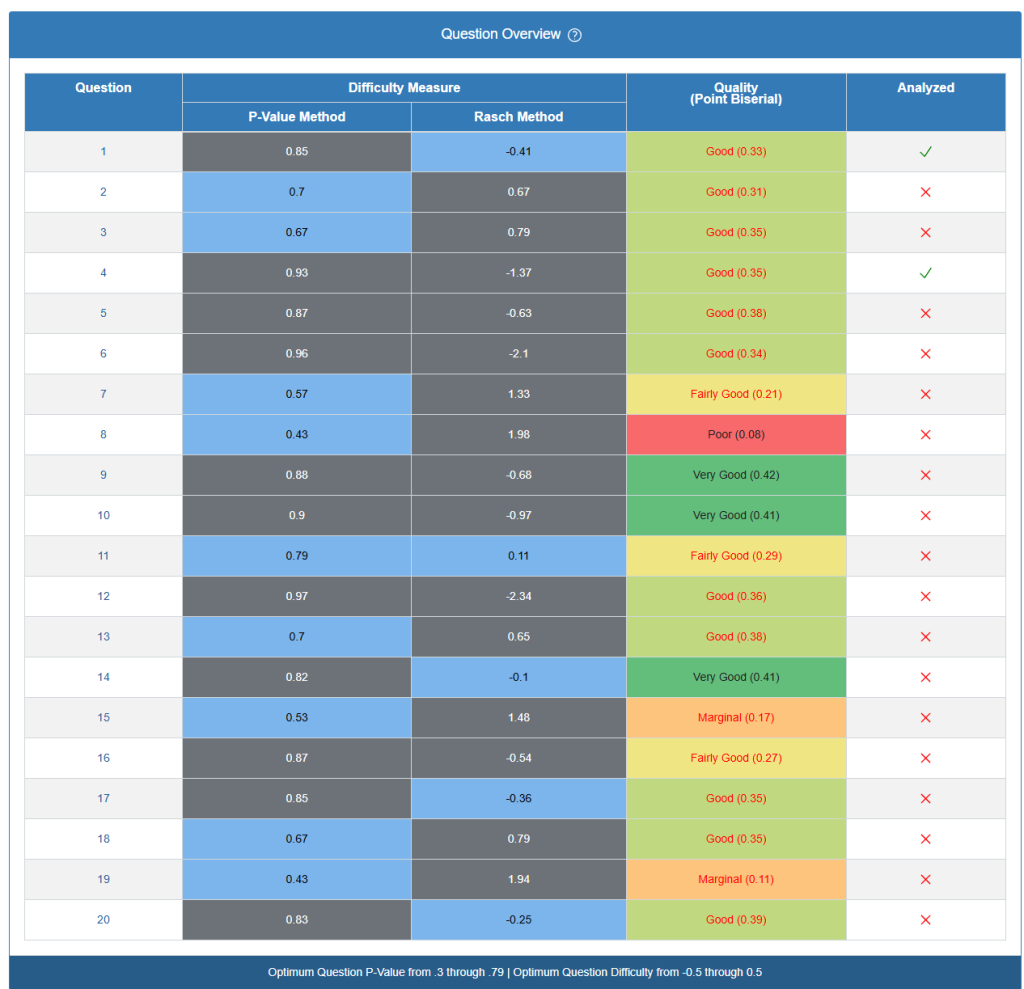
Question
Simply numbers your test questions (1, 2, 3, etc.) so you can easily identify which ones to review.
Difficulty Measure
Shows how hard or easy each question is using two different methods:
- P-Value Method
- This number tells you what percentage of students got the question right.
- Rasch Method
- Another way to measure difficulty using a different scale.
- Negative numbers (like -0.41) = Easier questions
- Positive numbers (like 1.98) = Harder questions
- Best range: Between -0.5 and 0.5
- Another way to measure difficulty using a different scale.
Quality Measure (Point Biserial)
This is crucial – it tells you if your question is actually testing what you want it to test. Look at the colors:
- Very Good (Green): Excellent questions that clearly separate strong students from struggling ones
- Good (Light Green): Solid questions that work well
- Fairly Good (Yellow): Decent questions but could be improved
- Marginal (Orange): Weak questions that need revision
- Poor (Red): Problem questions that should be rewritten or removed
Analyzed
The checkmarks (✓) and X’s (✗) show which questions have been fully reviewed by the system.
What This Chart Tells You
Each question is measured in three ways (P-Value, Rasch, Point Biserial Correlation):
1. How Hard Is It? (P-Value)
The percentage of students who answered correctly
- 0.90 or higher = Very easy (90%+ got it right) – might be too simple
- 0.70-0.89 = Moderately easy – good for confidence building
- 0.30-0.69 = Just right difficulty – separates students well
- 0.20-0.29 = Hard – only strong students succeed
- Below 0.20 = Very hard – might be unfair or poorly written
In this test: Question 8 (0.43) and Question 19 (0.43) are on the easier side, while Question 12 (0.97) was very easy for almost everyone.
2. How Hard Is It? (Rasch)
A more sophisticated way to measure difficulty that accounts for student ability
- Positive numbers = Harder questions (fewer students can answer correctly)
- Negative numbers = Easier questions (more students can answer correctly)
- -0.5 to +0.5 = Ideal difficulty range
How to read it?
- Question 8 (+1.98) = Much harder than average
- Question 6 (-2.1) = Much easier than average
- Question 14 (-0.1) = Perfect difficulty level
Why both P-Value & Rasch difficulty methods?
P-Value is simple math, but Rasch considers that some students are stronger test-takers overall. It’s like the difference between counting right answers versus understanding why students got questions wrong.
3. How Good Is It? (Point Biserial Correlation)
Does this question actually test what your students learned?
- 0.40+ = Excellent – students who know the material get it right, students who don’t get it wrong
- 0.30-0.39 = Good – working well but could be better
- 0.20-0.29 = Fair – needs some improvement
- 0.10-0.19 = Poor – might be confusing or testing the wrong thing
- Below 0.10 = Remove this question – it’s not helping you assess learning
What does this really mean?
- High correlation: Smart students get it right, struggling students get it wrong (this is what you want!)
- Low correlation: Results seem random – even your best students might get it wrong while struggling students get it right (this suggests a problem with the question)
In this test: Question 9 (0.42) is perfectly separating strong from weak students, while Question 8 (0.08) isn’t helping a reader understand who knows the material.
Best Questions ⭐
- Questions 9, 10, and 14 are working really well
- Students who know the material get these right, while students who struggle get them wrong
- Keep these questions for future tests!
Questions That Need Help ⚠️
- Question 8: Too hard (Rasch +1.98) and not measuring learning well (0.08 correlation)
- Questions 15 and 19: Easy but not great at showing who learned the material
- Question 7: Fair difficulty but only moderately good at assessment
What This Means for Your Classroom
Red Flags to Watch For:
- Questions with “Poor” quality ratings aren’t helping you assess student learning effectively
- Questions that are too easy (P-value above 0.80) don’t tell you much about student understanding
- Questions that are too hard (P-value below 0.30) might be unfairly difficult or confusing
Questions You Should Review:
- Any question marked as “Marginal” or “Poor” quality
- Questions where most students got it wrong (very low P-values) – check if the question is unclear
- Questions where everyone got it right (very high P-values) – might be too obvious
Good Signs:
- Green quality ratings mean your questions are working as intended
- P-values between 0.30-0.79 indicate appropriate difficulty
- Checkmarks in the “Analyzed” column mean the system has enough data to give you reliable feedback
Practical Next Steps
When you see problem questions:
- Poor Quality (Red): Rewrite the question completely or remove it
- Marginal Quality (Orange): Look for confusing wording or multiple correct answers
- Too Easy: Make the question more challenging or add it as a confidence-builder early in the test
- Too Hard: Simplify the language, check if it matches what you taught, or consider if it’s testing the right skill level
Right Now:
- Review questions 8, 15, and 19 – are they clear? Are there tricks or confusing wording?
- Consider dropping question 8 from scoring if it’s unfair
For Next Time:
- Rewrite the problem questions using clearer language
- Ask a colleague to review questions before using them
- Make sure questions match what you actually taught
The Bottom Line
Most of the questions (13 out of 20) are working well! A few need tweaking, but this is normal.
Quick Rule of Thumb: Good test questions should have most students getting them right if they studied, and wrong if they didn’t. If your best students are missing “easy” questions or struggling students are getting “hard” questions right, something might be wrong with how the question is written.